


Blog Post
Search Engine Optimization

Nadine
Wolff
published on:

Visualizing Internal Linking with Gephi – Part 1: Preparing the Data
Table of Contents
Internal linking is an important topic for search engine optimization and website usability. On the one hand, search engine crawlers need to be able to detect all relevant pages, topic clusters, and their prioritization. On the other hand, users must be able to navigate quickly and easily through the site to find exactly what they’re looking for. But how do you check whether your internal linking concept actually works?
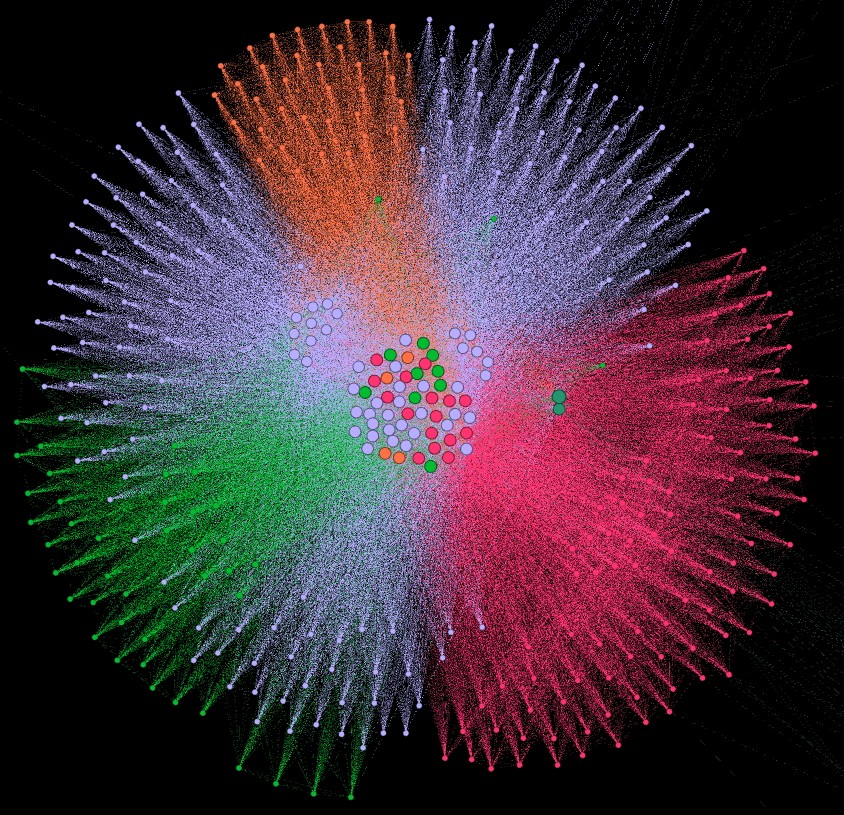
Visualizing Internal Linking: Step by Step
With Gephi, you can analyze and visualize a website's internal linking structure. Each landing page is represented as an individual node, showing its relationship to other pages (which page it links to and which pages link back to it)—and it's even color-coded to help you identify topic clusters within the site.
Gephi only relies on the imported dataset. Everything else is calculated mathematically, completely ruling out subjectivity. The tool is great for both agencies and in-house teams, as you can consistently uncover fresh insights.
Here is our step-by-step guide to visualizing internal links and turning those insights into action.
Visualizing internal linking
Actionable steps for internal linking
Visualizing internal linking – Conclusion
How do I install Gephi?
To use Gephi, you'll need at least Java 1.8 installed on your machine.
You can download the software directly from the developer's website. It's available for Windows, Mac OS X, and Linux. We recommend running the installer with administrator privileges, and the process should go smoothly. Simple enough so far!
When launching the program, you might run into the following error message. It doesn't matter whether Java was installed before or after Gephi.

Fig. 2: Gephi Error: Cannot find Java 1.8 or higher
This error happens because Gephi can't locate the path to the Java folder. To fix this, you just need to add the path manually in the configuration file. You'll specify the Java path in the gephi.conf file. Open this file using Notepad or a similar text editor. It is usually located at:
C:\Program Files\Gephi-0.9.2\etc (or wherever Gephi is installed on your computer)
By default, line 11 contains the entry “#jdkhome="/path/to/jdk"”.

Fig. 3: Contents of the gephi.conf file - Incorrect
Replace this line with “jdkhome="C:\Program Files (x86)\Java\jre1.8.0_161"” (enter the actual path to your Java folder here). Don't forget to remove the # symbol at the beginning of the line!

Fig. 4: Contents of the gephi.conf file - Correct
After that, Gephi should launch without any issues.
How do I create the data table for Gephi?
Unfortunately, Gephi can't crawl or map internal links on its own. In most cases, you'll need an additional tool to crawl the domain and output its link architecture. Unless you're analyzing massive sites like Amazon, Wikipedia, or Rakuten, Screaming Frog should work just fine. For much larger websites, you might want to look into tools like Audisto, deepcrawl, or similar platforms.
If your domain has fewer than 500 URLs, you can easily use the free version of Screaming Frog. For larger sites, you'll need the paid version, which—at £149 per year (around 170 euros)—is still more affordable than most alternatives.
Below, we'll walk through the process using Screaming Frog.
Crawling with Screaming Frog
To analyze internal links, we only need the domain's HTML pages. Other resources like JavaScript, images, CSS, etc., can be excluded right before the crawl begins. You can configure this under Configuration > Spider. Note that this option is only available in the paid version, but it will save you a good deal of cleanup work later.

Fig. 5: Crawl settings in Screaming Frog
Next, enter the correct homepage URL to start the crawl. Depending on the size of the domain, this can take anywhere from a few minutes to several hours. Once finished, you can export all internal links. The easiest way is to download them via Bulk Export > Response Code > Success (2xx) inlinks.
This ensures you only export internal links that point to pages returning a 200 (OK) status code, filtering out redirects (3xx) and error pages (4xx) right away. Now, you just need to prepare this spreadsheet for Gephi so you can visualize the domain and define your next steps.
Preparing the data for Gephi with Excel
The file exported from Screaming Frog contains plenty of data that Gephi doesn't actually need. That's why we need to clean it up first. You can use any spreadsheet program for this, such as Excel or OpenOffice Calc. We prefer Excel, so the following steps will reference its features. Here's the best workflow to follow:
Delete columns D – I: The information in these columns isn't required by Gephi.
Filter column A for anything that does not contain “AHREF” and delete those rows: This ensures only relevant text links remain (you can skip this step if you already filtered them via the Spider Configuration).
Delete column A: You won't need this column anymore after step 2.
Remove duplicates from columns A and B: If a page links to another page multiple times, Gephi still treats it as a single connection. Removing duplicates helps keep the file size manageable for Gephi. Just select both columns and go to Data > Data Tools > Remove Duplicates.
Remove self-referencing links: Many pages link back to themselves (via main navigation, logos, footers, or misconfigured breadcrumbs). These links will be in your dataset, but they won't add any value to your visualization. To remove them, enter the following formula in column C: =IF(A1=B1,1,0) (for row 1). Apply this formula to all rows, filter column C for “1”, and delete all those matching rows. Once done, you can delete column C.
Remove external links: The table often still contains links pointing to external domains. To spot them, sort column B alphabetically. Alternatively, you can search within the column for anything that doesn't include your own domain's hostname. Make sure to delete these rows.
Remove image and PDF links: Images and PDFs are sometimes linked within body copy. The easiest way to catch them is by filtering column B. Search for common file extensions (.pdf, .png, .jpg, .gif) one by one in the filter search and delete those rows.
Filter out non-relevant URLs: Depending on the domain, this step might take some time, but it's crucial. Otherwise, your Gephi graph will be cluttered with unnecessary data and become hard to read. We recommend opening a second Excel file and pasting both columns A and B from the original document stacked underneath each other into column A of the new sheet. Remove all duplicates from this combined column and sort it. Go through the list and identify any pages that aren't relevant for internal link equity (privacy policy, terms & conditions, legal notice, paginated pages, search result pages, etc.) or provide no SEO value (pages set to noindex). Remove these URLs from both column A and column B in your original document. You can look up each URL individually or streamline the process using a VLOOKUP.
Rename column B to “Target”: Gephi requires column B to have this header; otherwise, the tool won't be able to process the file correctly.
Remove the hostname: Since we're only looking at internal links and all remaining rows are internal, it helps to strip out the domain name. This makes labels much easier to read inside Gephi. Press CTRL + H, search for your hostname (for example: https://www.internetwarriors.de), and hit replace with nothing (Note: Keep the trailing slash after the hostname so your homepage URL isn't completely wiped out!).
Combine the columns: Gephi works with CSV files, so we'll need to format the Excel sheet accordingly. A simple concatenation formula does the trick. In column C, enter =A1&","&B1 (for row 1) and apply it to all rows. Next, remove the formula by selecting the entire column C, pressing CTRL + C, right-clicking, and choosing Paste Values. Now that the formulas are replaced with plain text values, you can safely delete columns A and B so your combined values become the new column A.
Export as CSV: Finally, save the file as a CSV. Head to File > Save As and choose the CSV (MS-DOS) format.
In part two, we'll dive deeper into Gephi's features and explore how to create the visualization in detail.
How can we help you?
Are you looking for an online marketing agency? We'd love to assist you—from strategic, creative planning all the way to hands-on execution aligned with GDPR standards. Feel free to reach out to us anytime!
Nadine
Wolff
As a long-time expert in SEO (and web analytics), Nadine Wolff has been working with internetwarriors since 2015. She leads the SEO & Web Analytics team and is passionate about all the (sometimes quirky) innovations from Google and the other major search engines. In the SEO field, Nadine has published articles in Website Boosting and looks forward to professional workshops and sustainable organic exchanges.
