


Blog Post
Web analytics

Nadine
Wolff
published on:

User | Session | Hit – How to Draw the Right Conclusions with Google Analytics
Table of Contents
Google Analytics is one of the most popular web analytics tools out there. Provided free of charge by Google, it allows website managers to analyze their site's performance. Based on the collected data and how it compares to your goals, you can make informed adjustments to your website to reach and continually improve your desired performance.
To help categorize this data, Google Analytics uses defined scopes, which play a central role in your web analytics. To evaluate the data properly and take effective action, it’s important to understand what each scope represents.
Figure 1: Google Analytics – the most widely used web analytics tool
In this blog post, we’d like to walk you through the User, Session, and Hit scopes in detail. Every dimension in Google Analytics is assigned to a scope. These definitions form the foundation of many reports and are essential for interpreting your data correctly.
The prerequisite for successful web analytics with Google Analytics
Before you can use Google Analytics for your website, you'll need to sign up for Google Analytics and create an account for your site. You will receive a snippet of JavaScript code that you need to embed into your website's source code. Please make sure to implement data privacy correctly—otherwise, you could face costly legal warnings. You can find step-by-step guidance in our blog post on Google Analytics Basic Configuration.
Google then gathers the incoming data and makes it available to you within 24 hours. Using predefined reports, you can easily compare metrics and see how they connect. Examples of measurable metrics include pageviews, sessions, bounce rate, time on page, and conversion rate.
Before deciding to use Google Analytics, however, it's a good idea to define what your website's goals are and which parameters can best measure or analyze them. Don't rush into conclusions, though: using dimensions correctly is key to accurate insights!
Users in Google Analytics – categorizing visitor types correctly
A user is anyone who opens a website and, in Google Analytics terms, starts a session. A first-party cookie is attached to the user's IP address, categorizing them as a "New Visitor" on their first visit and as a "Returning Visitor" on subsequent visits. The cookie set after the first visit remains active for two years from the most recent visit. So, if a user visits your site again after two years and two weeks, they will be counted as a new user.
The same thing happens if users clear their cookies, or—in mobile apps—uninstall and then reinstall the app. If a user opens your website across three different browsers (for example, Microsoft Edge, Mozilla Firefox, and Google Chrome), new cookies are set in each, identifying the visitor as new each time.
Beyond pure traffic volume, your share of returning users is a strong sign of lasting interest in your website. Because of this, it's definitely a metric worth keeping an eye on.
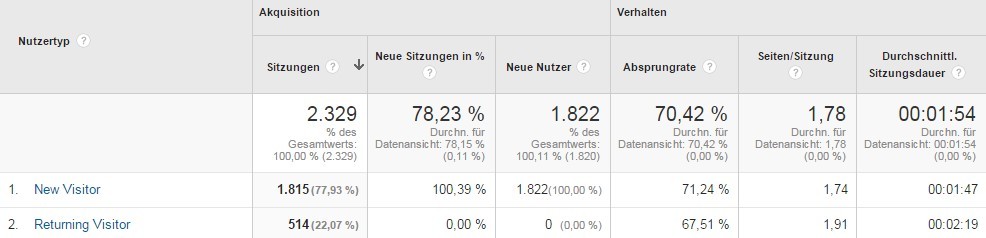
Figure 2: View in Google Analytics | New and returning users
Additionally, other user-level attributes are sent to Google and stored within this scope. These include, for example:
Age
Gender
Country
City
These attributes are considered user-based dimensions associated with that specific visitor.
Session – opening the website kicks off the session
A session begins the moment a user first opens a website or triggers the first hit that can be attributed to that session. A session represents the total sum of interactions a user has on your website within a given time frame. You can think of a session as a large container holding all of these actions together. Here’s how it works:
A session belongs to exactly one user, but can include multiple events.
A user can have one or more sessions on a website and trigger one or more events within each session.
A session cannot belong to multiple users.
One user (identified via cookie) can have multiple sessions.
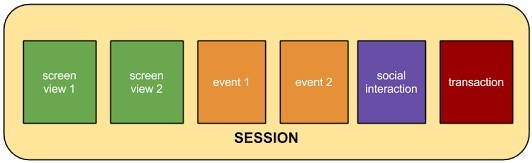
Figure 3: Visualization of a session | Source: support.google.com
Session-based dimensions linked to a session include:
Source
Medium
When does a session end? By Google’s definition, a session ends after 30 minutes of inactivity—meaning the user hasn't viewed another page, clicked, or taken any other action on your site for half an hour.
A session also ends automatically at the end of each day, right at midnight (11:59:59 PM). So, if you're browsing a website late at night across midnight, Google Analytics may count it as two separate sessions.
Finally, a session ends whenever a user accesses the site via a new campaign (a change in channel). This happens regardless of whether the current session was still active. Direct traffic is the only exception here.
Hit – user interactions on your website
When we talk about a hit or an event on a website, we mean the user's activities and interactions with elements on the page. Common hits include:
Pageview
Page title
Landing page
Event category
Button clicks (e.g., clicking a PRINT button, a link, or submitting a form)
Scroll depth
All of these attributes belong to the hit-based dimensions sent over to Google.
Because interacting with elements (like clicking a button or scrolling) doesn't load a new page, these actions are treated as individual events and aren't automatically tracked the way pageviews are. Instead, you'll need to set up custom tracking to analyze how specific elements are being used. You can achieve this using Universal Analytics or by setting up event tracking in Google Tag Manager.
Each event can be defined with four parameters—Category, Action, Label, and Value—to keep user interaction data neat and structured in Google Analytics. Event tracking helps you better understand what your users care about, optimize the placement of call-to-action buttons, and evaluate how content performs across topics. From there, you can easily fine-tune your website's design.
A quick tip for analyzing data in Google Analytics
Before you dive into analyzing your data, here's a helpful tip: not all dimensions and metrics can be combined. For example, while pageviews are hit-based, unique pageviews are session-based. This means predefined events can be paired with total pageviews, but not with unique pageviews.
To make things easier, Google provides a fantastic tool where you can instantly check which dimensions and metrics can be combined. The Dimensions & Metrics Explorer gives you a straightforward way to explore every reporting possibility.
How we can help
Looking to use Google Analytics to track your website’s success and turn that data into long-term insights? We're always happy to help with any questions about setup, implementation, or analysis. Feel free to reach out—we’d love to guide you through your web analytics journey!
Nadine
Wolff
As a long-time expert in SEO (and web analytics), Nadine Wolff has been working with internetwarriors since 2015. She leads the SEO & Web Analytics team and is passionate about all the (sometimes quirky) innovations from Google and the other major search engines. In the SEO field, Nadine has published articles in Website Boosting and looks forward to professional workshops and sustainable organic exchanges.
